

How does the pre-sleep state change?
Self-reports, facial movements, EEG
When changes appear and how records compare.
WILL YANG / 杨朋翰

I’m Will Yang. With a background in psychology, I work on behavioral research and solutions at Noldus.
I believe every problem is a technical problem.
I help teams turn vague questions into research and action. Start with this sleep-support drink.
Start with this glass ↗AI scene illustration · a real research story
A SEEMINGLY SIMPLE QUESTION
“I seem to sleep better after drinking it” is a starting point. What evidence would you explore first?
Each observation has value. Choose one to see what it can tell us.
Keep these observations. Now unfold the timeline.
We now enter an afternoon laboratory nap study. The images are illustrative.
 01Before sleepHow sleepiness changes
 02Falling asleepHow sleep begins03After wakingHow we perform after waking
Before sleep: observe for 30 minutes after intake, with sleepiness ratings every five minutes.
Sleep onset: observe for 30 minutes after lights off, aligning arm EMG and EEG.
After waking: a 15-minute phase includes self-reports and a 20-second search, separating attention and task completion.

01 / BEFORE SLEEP
Self-reports matter. We can also compare them with movements recorded during the same period.
FROM A MOMENT TO A PERIOD
Across 30 minutes watching a documentary, participants rate sleepiness every five minutes while video records eyelid and other facial movements. Aligning feelings and movements in time gives us a basis for comparison.
Measurement animation · illustrative images and traces

A camera records the face; the algorithm locates its region.
Landmarks around the brows, eyes, nose and mouth track changes in facial geometry.
AU means action unit. AU43 describes eye closure; action intensity forms a time series. This explains extraction; the reported eye-closure measure appears in the results.
Recording plan · not measured results
Facial analysis records eyelid and other movements; EEG adds another record. A movement alone does not establish sleepiness or product efficacy.
Facial analysis turns movements in video into comparable records. Here, eyelid and eye-closure movements provide clues before sleep; they do not independently reveal someone’s feelings.
Explore this method →EEG records voltage changes detected by sensors over time. Interpretation depends on the task and analysis conditions. A waveform alone does not establish a sleep benefit.
Explore this method →AI illustration · not a participant photograph
02 / FALLING ASLEEP
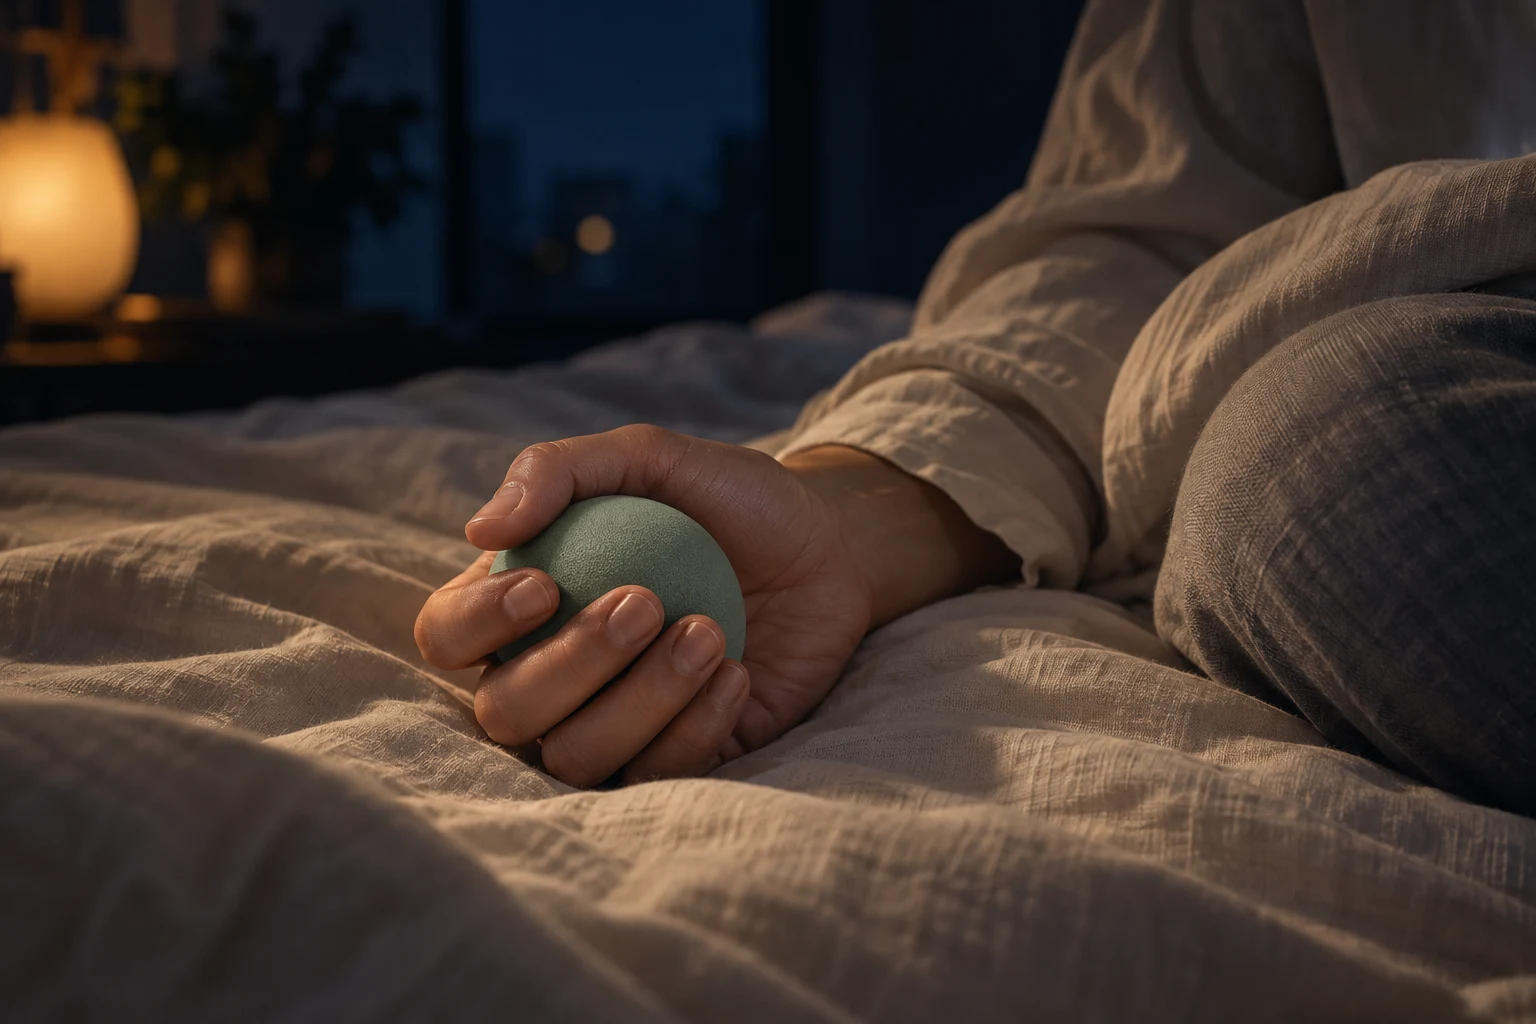
Participants grip and release a soft ball with their breathing for as long as they can. Arm EMG records the associated muscle activity.
GRIP · RELEASE · RECORD
EMG records electrical activity associated with muscles; EEG records brain electrical activity. Aligning them after lights off helps us observe sleep onset. Failure to grip the ball alone does not establish that someone is asleep.
Measurement animation · illustrative images and traces
Scalp electrodes record small voltage differences relative to a reference, followed by amplification and digitization.
Inspect contact quality and artifacts such as blinks and muscle activity, then analyze usable periods. These traces are illustrative, not participant recordings.
Analyze frequency-band power and calculate ratios such as alpha/beta and theta/alpha, aligned with study time. Actual reported ratios can be compared in the results.
Measurement animation · illustrative images and traces
Surface electrodes on the arm record voltage changes associated with muscle activity.
Gripping and releasing change muscle electrical activity; signal inspection and processing produce comparable records.
Align EMG and EEG on one time axis to examine their relationship, without inferring sleep from one movement alone.
Explore electrodes, signal processing and time alignment. The animation explains measurement; quantitative experimental results follow in the charts.
Surface EMG records electrical signals associated with muscle activity. It helps observe activity timing and changes, but does not directly establish sleep state.
Explore this method →EEG records voltage changes detected by sensors over time. Interpretation depends on the task and analysis conditions. A waveform alone does not establish a sleep benefit.
Explore this method →AI scene illustration · the animation is not measured data
03 / AFTER WAKING
Alongside asking about alertness, watch someone complete a small task.
Simplified web activity: find 5 As among 24 letters, without a timer or score. The actual study used 117 letters, 10 targets and a 20-second limit. You can also go straight to the report.
Clicks tell us which positions were chosen; task completion tells us how many targets were found.
Eye tracking can additionally record where gaze lands and how fixations are distributed. This page does not track gaze or compare your clicks with study results.
Measurement animation · illustrative images and traces
Eye-tracker cameras capture eye images and locate the eyes.
With near-infrared illumination, algorithms detect the pupil center and corneal reflections. The overlay illustrates this principle.
After calibration, eye features map to gaze positions for fixation count, duration and target-area analysis. This report presents fixation counts; pupil size can also be recorded separately.
Eye tracking records where gaze pauses and moves. It helps examine visual search. Website clicks are not gaze data, and looking somewhere does not establish understanding.
Explore this method →A defined task makes starting, performing and finishing observable. This letter search demonstrates task records, not a test of your ability or sleep.
Explore this method →FROM EXPERIENCE TO EVIDENCE
The same two participants experienced sample milk and regular milk. Compare the phases to see where records differ and how observations complement one another.
Actual experimental results · two participants, sample and regular-milk crossover
An eye-closure movement index, not a sleepiness percentage. Compare the first and last five-minute intervals.
EEG α/β is a frequency-band ratio selected in the report, a different observation channel from eyelid movements.
This is an EEG θ/α ratio. EMG from the grip task is a separate recording, not what this chart displays.
The same 0–3 scale as A preserves both complete sample and regular-milk series.
Eye tracking records gaze locations; fixations and clicks are distinct. Total, target and non-target categories remain visible.
The study used a 20-second search: 10 targets among 117 letters. These are report summaries, not your website task results.
Reported index
At 0–5 min: sample 0.257, control 0.061. At 25–30 min: 0.360 and 0.363. The initially larger difference narrows; a single overall answer loses timing information.
These are differences in eyelid movement records, not established onset-of-effect times or general efficacy.
At 10–15 min: sample 2.423, control 1.414. Across the complete period, the direction and size of differences vary.
The ratio is not a universal relaxation score and does not alone establish efficacy.
Record A at 5–10 min: sample 2.043, control 1.513. Switch to B to compare the same interval on the same scale.
A and B are separate participant records, not group means. The ratio does not directly give exact sleep depth or sleep-onset time.
Record B at 5–10 min: sample 0.310, control 0.803. Their ordering differs from A; individual differences should remain visible.
Two records cannot establish general efficacy or how many minutes earlier someone fell asleep.
Target fixations: sample 25.5, control 11.0; non-target: 42.5 and 44.5. This adds process information beyond completion.
More fixations do not automatically mean higher efficiency. These report summaries are not compared with visitor clicks.
Target-click summaries: sample 8.5, control 6.0. They add a record of task completion alongside subjective feelings.
These are not completion times, accuracy rates or individual scores. Incomplete aggregation details do not support added significance tests.
Report slide 7Crossover experiment · actual reported results
Selected charts from the 2023 report. Line values display three decimal places; plots retain source precision. The formal afternoon laboratory protocol included 30 minutes of preparation, 30 minutes before sleep, 30 minutes after lights off and a 15-minute waking phase including the 20-second search. Two participants experienced the sample and regular-milk control, after screening for self-reported benefit. A and B remain separate records. Lines connect reported five-minute intervals without smoothing; bars start at zero.
These observations illustrate how research produces evidence, not universal efficacy. The report does not provide uncertainty intervals or complete aggregation details for these charts; no error bars or significance tests have been added.
| Period (min) | Sample | Control |
|---|---|---|
| 0-5 | 0.257 | 0.061 |
| 5-10 | 0.341 | 0.119 |
| 10-15 | 0.373 | 0.194 |
| 15-20 | 0.366 | 0.278 |
| 20-25 | 0.355 | 0.376 |
| 25-30 | 0.360 | 0.363 |
| Period (min) | Sample | Control |
|---|---|---|
| 0-5 | 1.318 | 1.554 |
| 5-10 | 1.805 | 1.368 |
| 10-15 | 2.423 | 1.414 |
| 15-20 | 2.409 | 1.383 |
| 20-25 | 1.375 | 1.724 |
| 25-30 | 2.141 | 1.494 |
| Period (min) | Sample | Control |
|---|---|---|
| 0-5 | 0.529 | 0.816 |
| 5-10 | 2.043 | 1.513 |
| 10-15 | 2.696 | 2.331 |
| 15-20 | 1.883 | 2.334 |
| 20-25 | 2.075 | 1.930 |
| 25-30 | 0.788 | 1.524 |
| Period (min) | Sample | Control |
|---|---|---|
| 0-5 | 0.290 | 1.656 |
| 5-10 | 0.310 | 0.803 |
| 10-15 | 1.003 | 0.993 |
| 15-20 | 0.462 | 0.597 |
| 20-25 | 0.985 | 0.345 |
| 25-30 | 1.171 | 0.384 |
| Category | Sample | Control |
|---|---|---|
| Total | 68.0 | 55.5 |
| Target | 25.5 | 11.0 |
| Non-target | 42.5 | 44.5 |
| Category | Sample | Control |
|---|---|---|
| Target clicks | 8.5 | 6.0 |
FROM A REQUEST TO A DELIVERABLE
We are still asking whether it works, but can now explain which observations inform the answer.
Illustrative deliverable structure · organized from this story
Self-reports, facial movements, EEG
When changes appear and how records compare.Grip-task EMG and EEG
Process clues, individual differences and interpretation limits.Self-reports, search-task gaze and completion
Attention allocation and task performance beyond feelings.This is what “technical” means in this story: define the question and make observation and validation possible. A complete process can still conclude that more research is needed.
Which part does your question need? →Unfolding a question makes action more specific. Choose a direction to explore my work.